

Insights & Analytics
What this achieves
Section titled “What this achieves”Insights and analytics is where the data your workforce generates becomes something you can act on — capability shortfalls, retention risk, and progress against goals. It also holds the oversight surfaces for Humavera’s AI, so you can see what it did and what it cost.
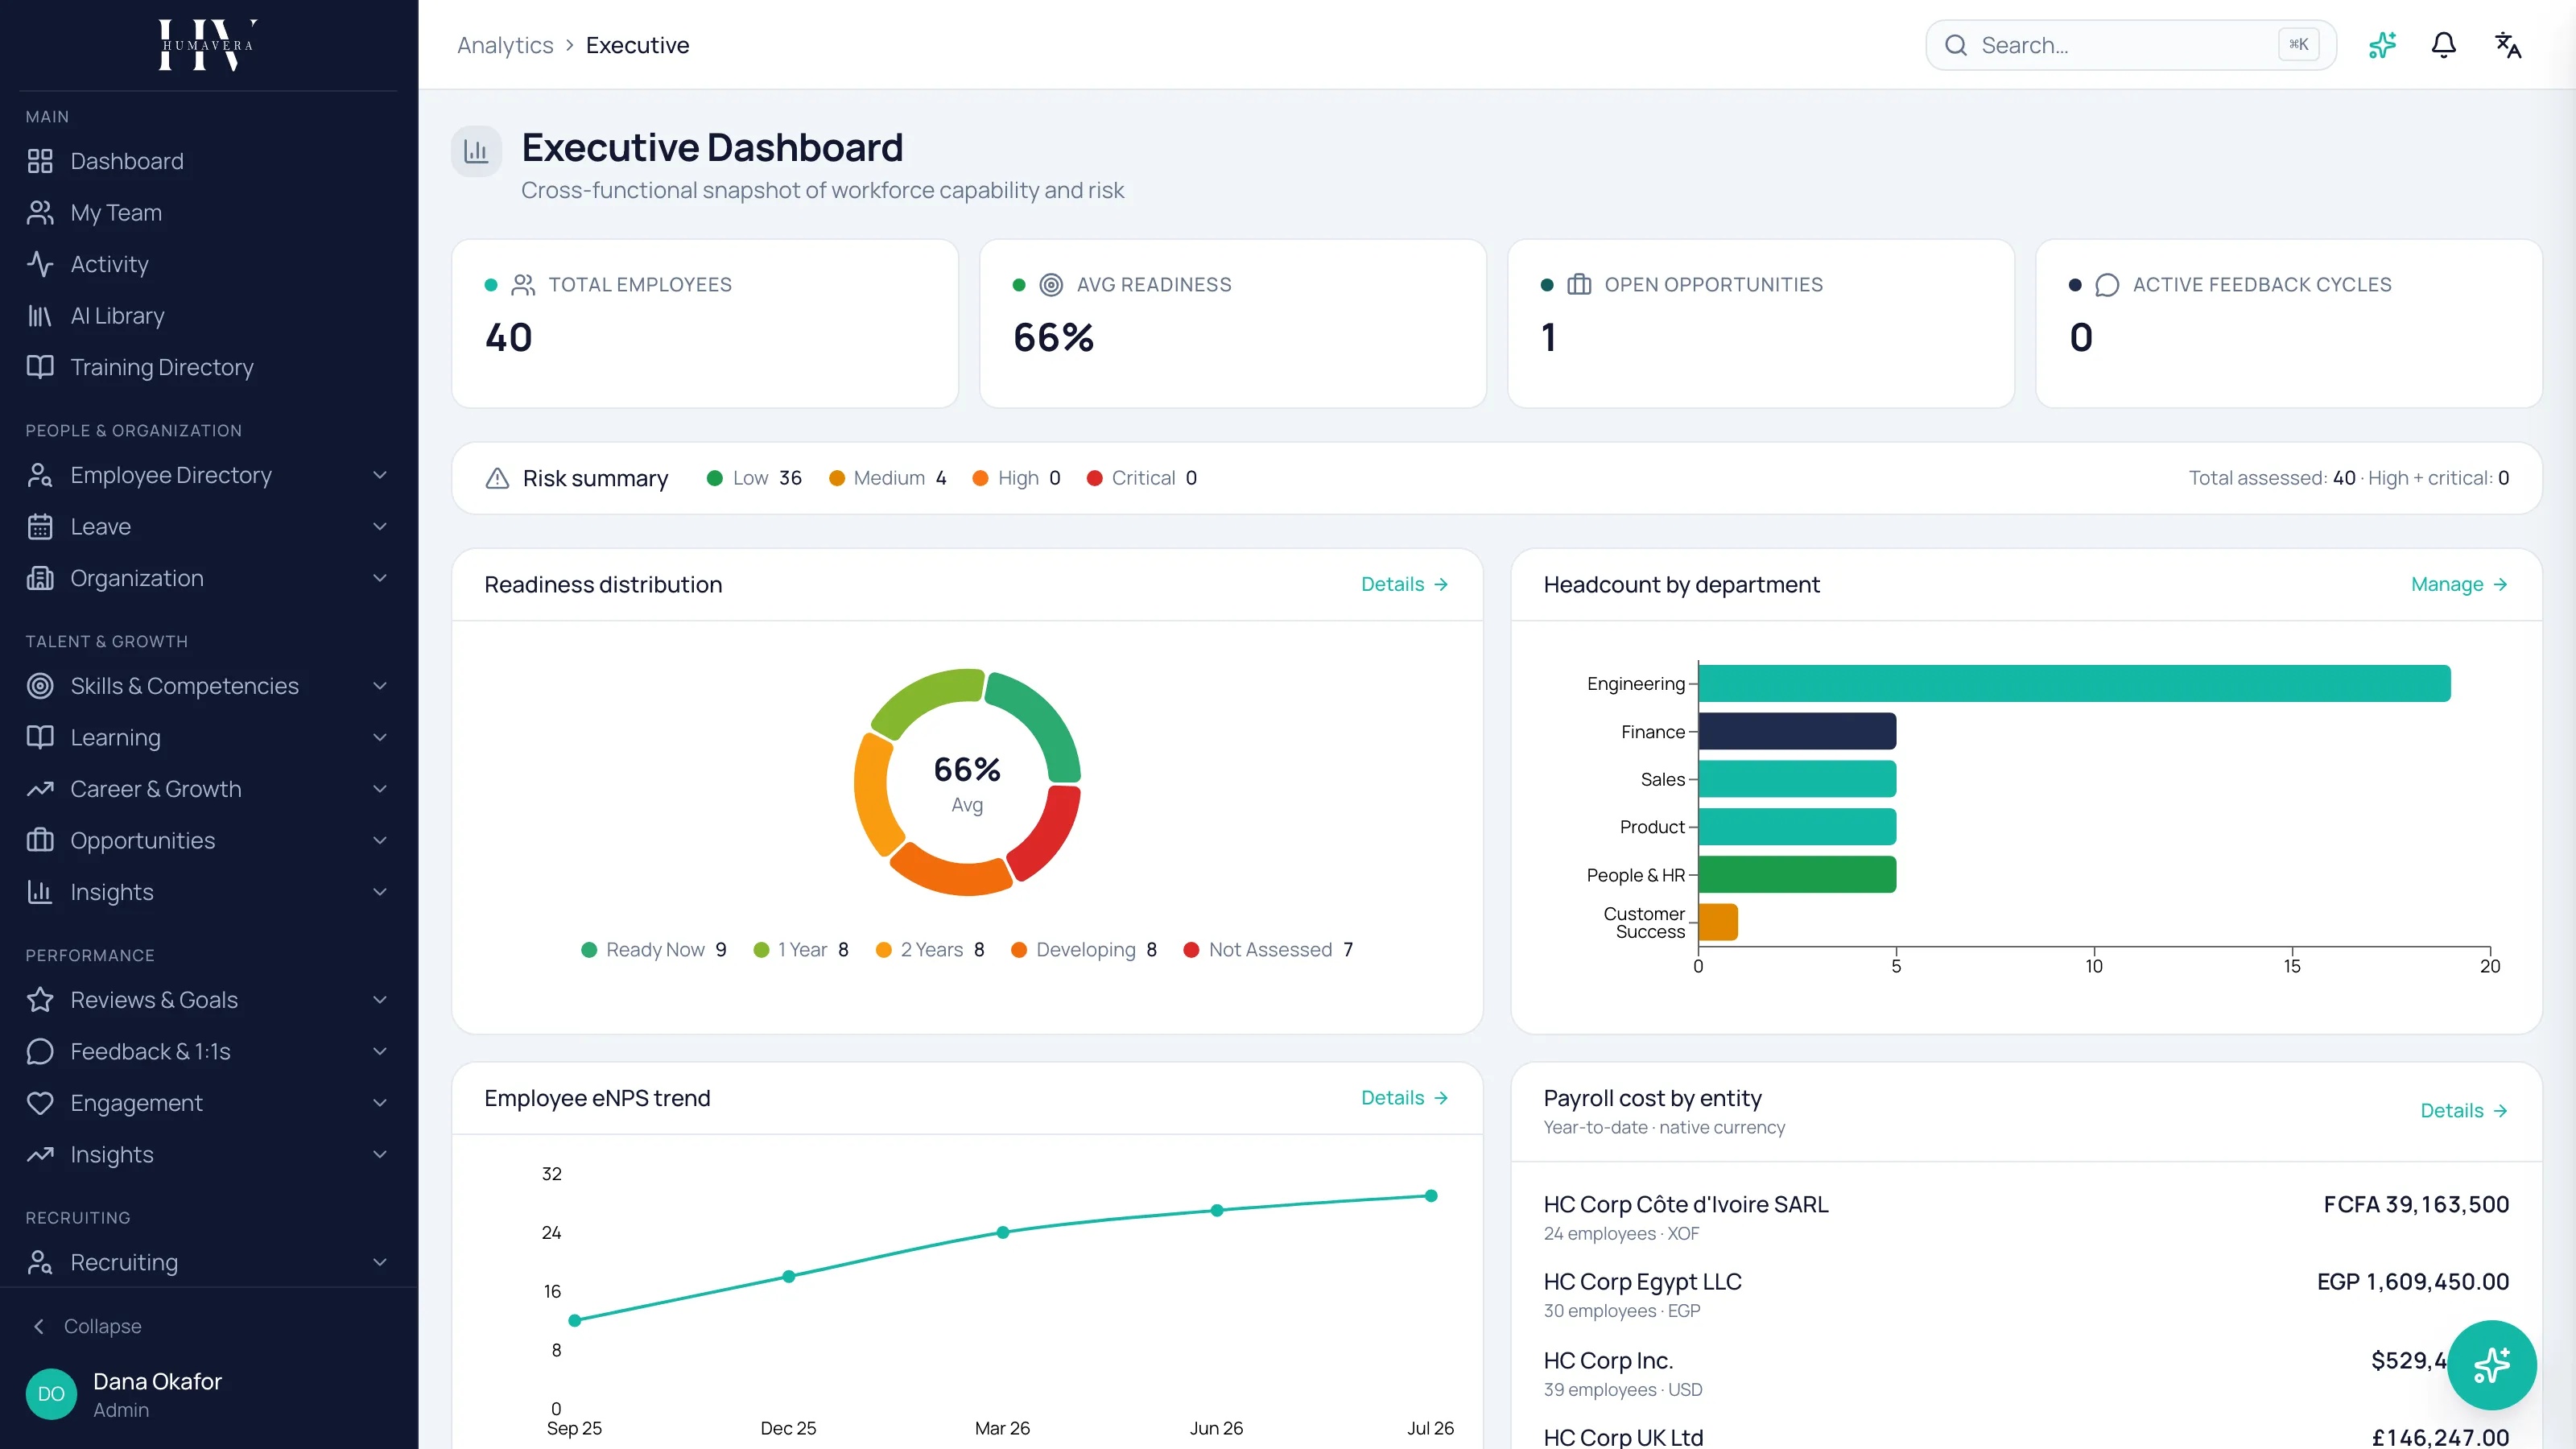
Four kinds of analysis
Section titled “Four kinds of analysis”| Option | Description |
|---|---|
| Executive view | Flight risk, workforce, capability, and organizational goals aggregated for leadership. |
| Predictive | Attrition and performance prediction, with trend analysis, rather than a description of the past. |
| Capability | Skill gaps, heatmaps, and demand against supply, by role and department. |
| AI governance | What the AI did, whether it shows bias, and what it consumed. |
Everything is scope-enforced
Section titled “Everything is scope-enforced”An analytics figure is bounded by what the person reading it is entitled to see. That is enforced when the data is fetched, so a company-wide figure is genuinely an administrator surface.
Example: Daniel Okonkwo sees company-wide analysis at HC Corp. Olivia Bennett sees her own team, and reaches team capability through her team views rather than through a company-wide report.
The consequence worth stating: two people quoting “the number” may both be right, because they were answering different questions.
Flight risk is a prompt, not a verdict
Section titled “Flight risk is a prompt, not a verdict”Flight-risk scoring identifies employees at elevated risk of leaving, with high and critical lists and the indicators behind a score. Scores can be acknowledged, which records that somebody looked.
Treat a score as a reason to have a conversation. It is a model’s estimate from patterns in your data, not a statement about a person’s intentions, and the indicators matter more than the number.
Example: a high flight-risk score for James Whitfield is a prompt for Olivia Bennett to talk to him about his development plan — not grounds for a decision about him.
Reports you build yourself
Section titled “Reports you build yourself”Beyond the prepared views, you can build reports, save them, run them on a schedule, share them, and export them. Board-level governance reports are a distinct output aimed at that audience.
A saved, scheduled report is the one to reach for when a question recurs. Anything you find yourself rebuilding monthly should be a saved report.
Snapshots and action plans
Section titled “Snapshots and action plans”Workforce snapshots capture the position at a point in time, which is what makes an honest before-and-after comparison possible. Humavera can also generate action plans proposing remediation from what the analysis shows, and scheduled digests push metrics to people rather than waiting for them to look.
AI governance
Section titled “AI governance”Because Humavera uses AI in several places, it exposes the oversight to match.
| Option | Description |
|---|---|
| Prompt logs | A record of AI calls made in your workspace. |
| Bias monitoring | Detection of bias in AI recommendations across areas such as hiring, promotion, and learning, tracked over time. |
| Credit usage | AI consumption by feature, so cost is attributable. |
Bias monitoring exists because AI recommendations touch decisions about people. If you use AI features, review it on a schedule rather than after a complaint.
What happens next
Section titled “What happens next”Analysis points at work owned elsewhere. A capability gap becomes learning or hiring; a flight risk becomes a career conversation; a goal falling behind becomes a performance discussion. Recommendations produced here can be accepted, dismissed, or rated, and that feedback is itself recorded.
Related
Section titled “Related”© 2025-2026 Humavera Documentation - BPilot Ltd. All Rights Reserved