

Read the executive dashboard
What this achieves
Section titled “What this achieves”The executive dashboard puts the headline numbers about your workforce on one screen — how many people you have, who might leave, where capability is short, and whether company goals are on track. It is a reading screen: nothing on it changes anything, and every panel links through to the analysis it summarises.
Required role: Administrator.
- Go to Performance → Insights → Executive.
- Read the four figures across the top, then the Risk summary strip beneath them.
- Read the six panels below.
- Select Details on any panel to open the full analysis behind it.
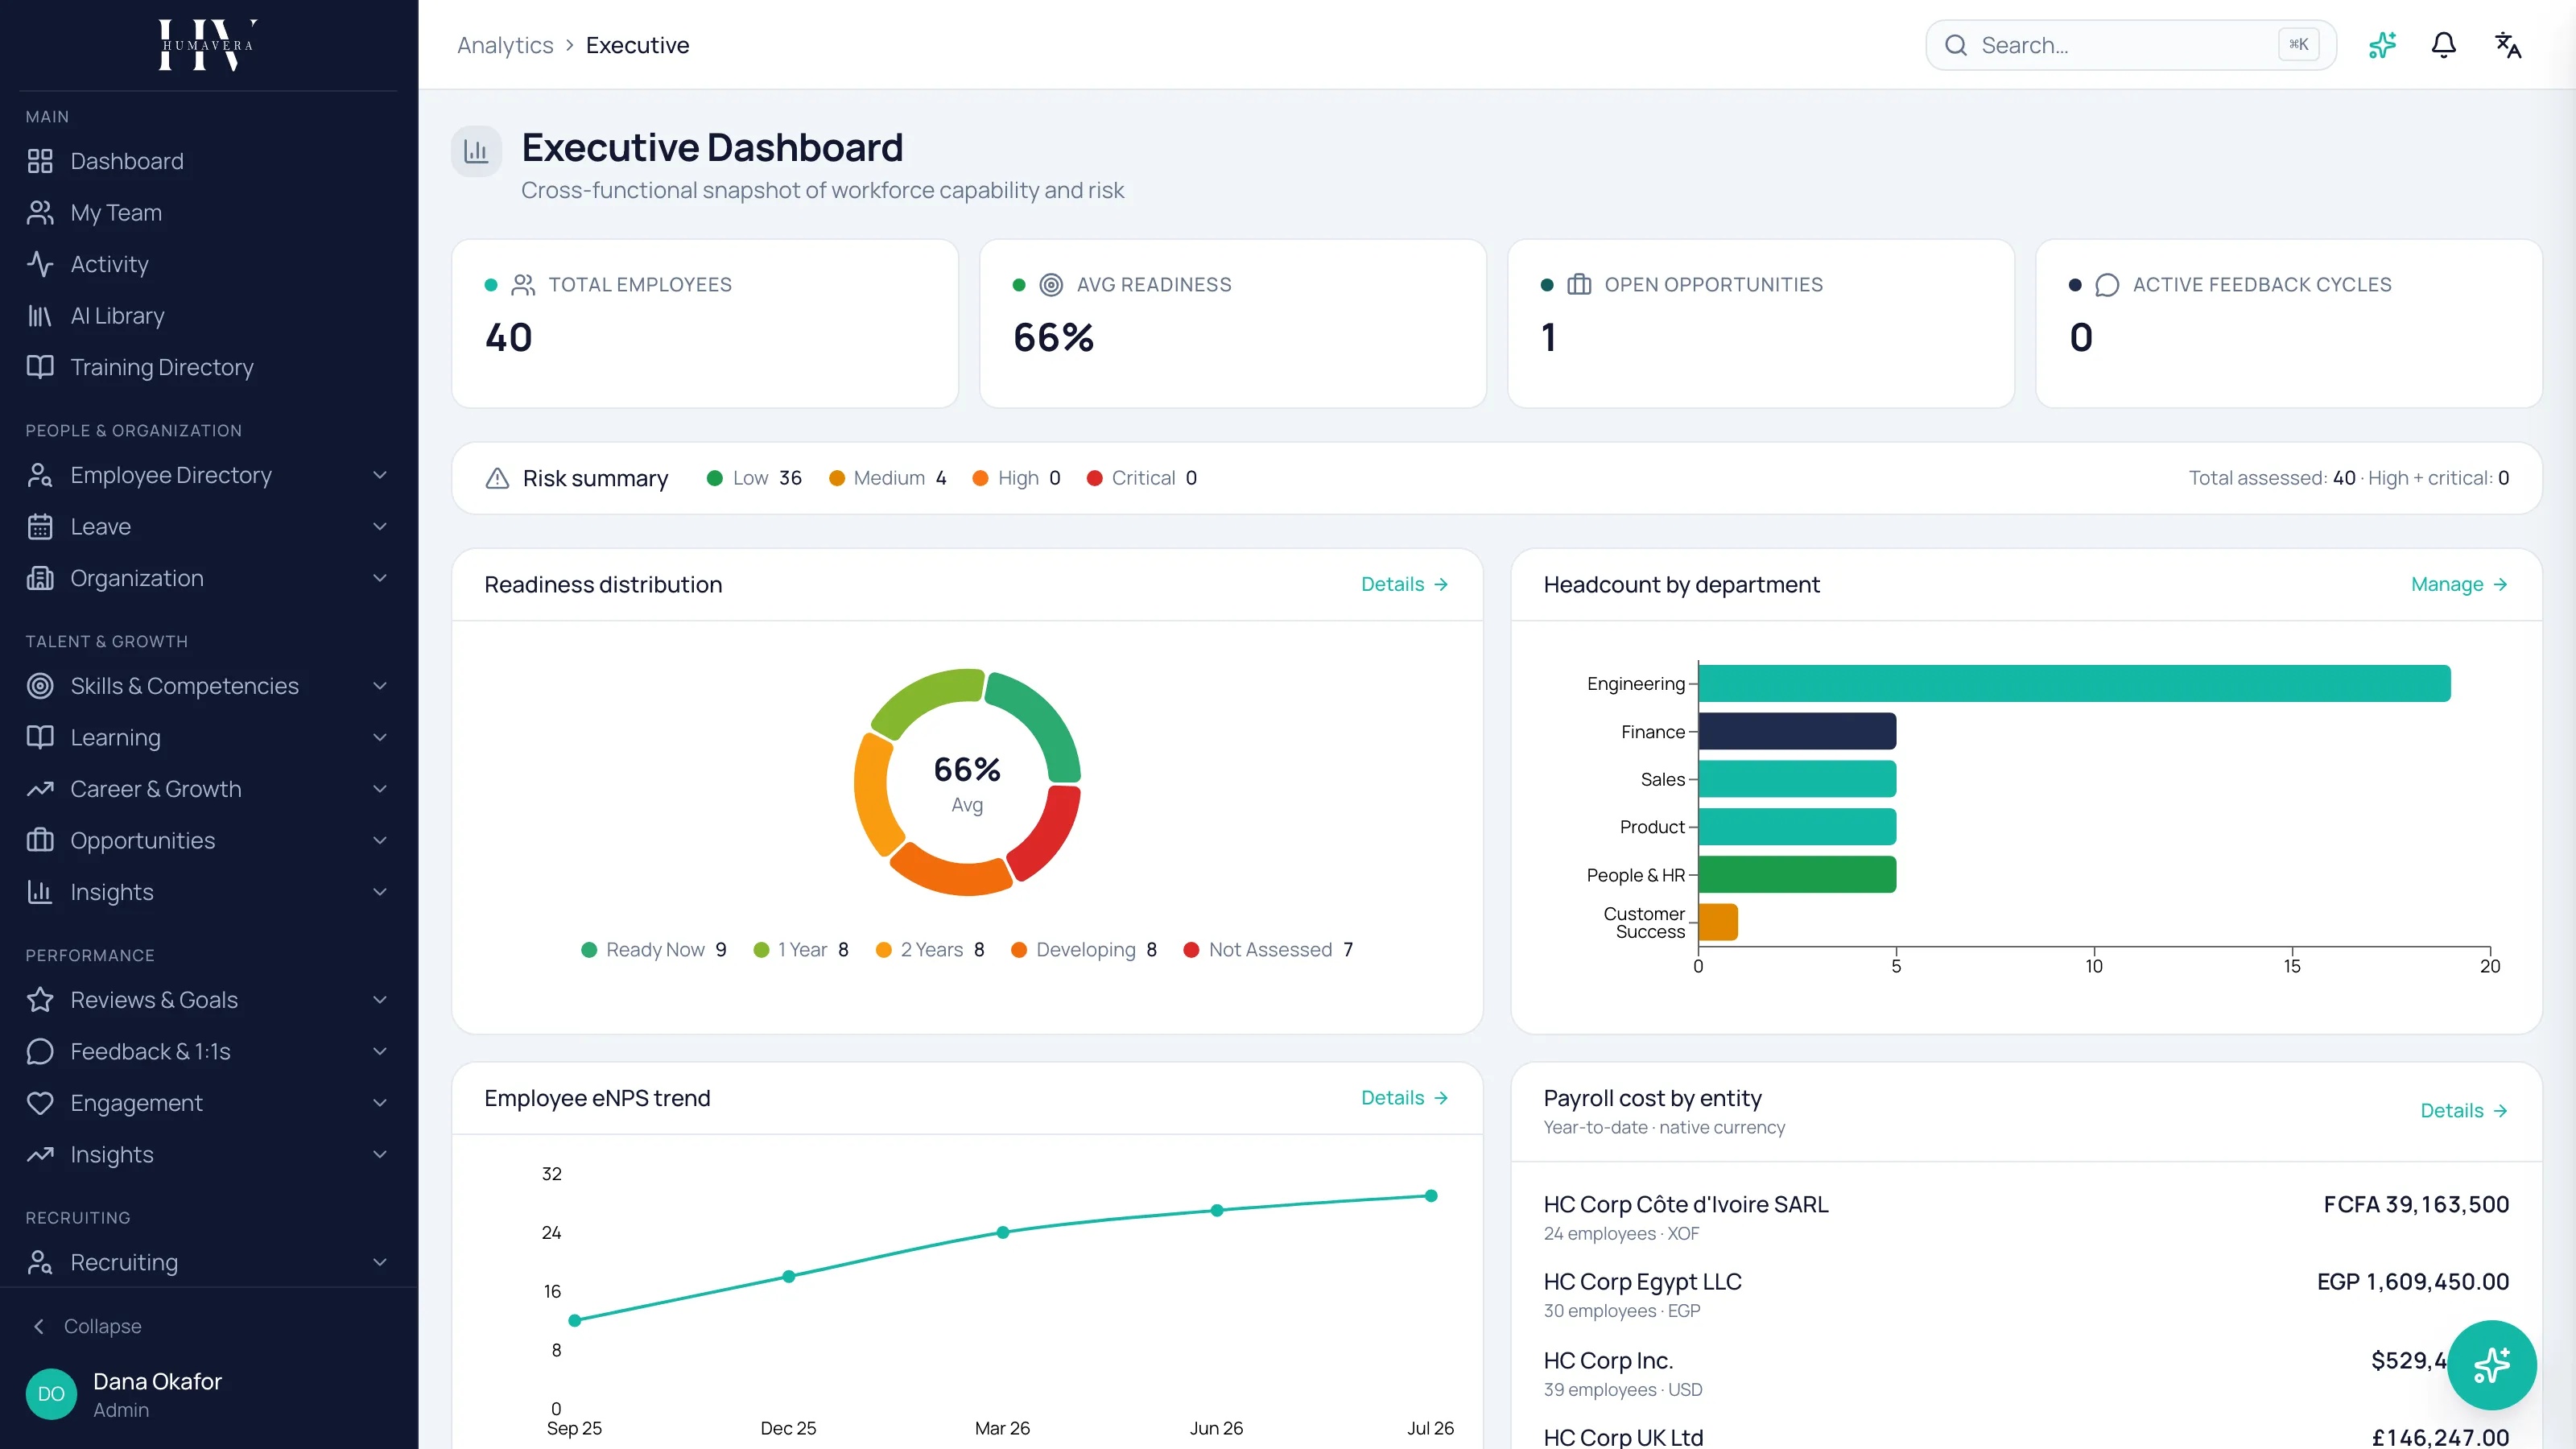
The four figures across the top
Section titled “The four figures across the top”| Option | Description |
|---|---|
| Total Employees | Headcount for the company. |
| Avg Readiness | Average readiness score across employees who have been scored against a target role. |
| Open Opportunities | Internal opportunities currently open. |
| Active Feedback Cycles | Feedback cycles currently running. |
A figure shows — when there is nothing to report rather than showing zero, so a dash means no data, not a value of nought.
The Risk summary strip
Section titled “The Risk summary strip”The strip counts employees by flight-risk level — Low, Medium, High, Critical — and closes with Total assessed and High + critical.
Read Total assessed first. Flight-risk levels are only counted for employees who have a score, so the four counts describe the assessed population and not your whole workforce.
Example: if 60 people at HC Corp UK Ltd have been scored and 6 of them are high or critical, the strip shows 6 out of 60. It does not tell you anything about anyone who has never been scored.
Where no scores exist at all, the strip says so and links you to the flight-risk screen to generate them.
The six panels, and where each number comes from
Section titled “The six panels, and where each number comes from”This is the part worth knowing before you quote anything off this screen. The panels do not all read from the same place, and two of them are as at a point in time rather than as at now.
| Option | Description |
|---|---|
| Readiness distribution | Employees by readiness category, with the average in the centre. Read from the latest company workforce snapshot, not from live scores. |
| Headcount by department | A live count of employees per department. |
| Employee eNPS trend | The engagement score over recent survey history. |
| Payroll cost by entity | Year-to-date gross from finalised payroll, one line per legal entity, each in that entity’s own currency. Labelled on screen as Year-to-date · native currency. |
| Top skill gaps | The five largest company-wide skill gaps, counted as employees below the required level. |
| Company OKR health | Company goals counted as On track, At risk, and Behind, with the most recent few listed. |
Example: at HC Corp, Headcount by department shows Engineering as it stands today. Readiness distribution shows the position as at the last snapshot — if that snapshot was taken in March, it still describes March, however many people joined since.
If Readiness distribution is empty while the readiness matrix has scores in it, the cause is that no company snapshot has been generated. Generate one and the panel populates.
Currencies are not combined
Section titled “Currencies are not combined”Payroll cost by entity lists each legal entity separately in its own currency. There is no combined total, because no exchange rate is applied anywhere in Humavera.
Example: HC Corp’s four entities appear as four lines — GBP, USD, XOF, and EGP — never as one. Adding them together is a decision for your finance team, at a rate they choose.
Panels fail independently
Section titled “Panels fail independently”Each panel loads on its own. One panel showing an empty or error state does not mean the rest of the screen is wrong — read the others normally and follow the link on the failing one to see what is missing underneath it.
What happens next
Section titled “What happens next”Nothing on this screen is a decision. Each panel is a pointer: a rising high-and-critical count is a reason to open flight risk and read the indicators behind individual scores; a large skill gap is a reason to open gap analysis and see whether it is one person or a whole team; a goal marked behind is a conversation with its owner. If you intend to compare this position against a later one, generate a workforce snapshot now, because a comparison needs two fixed points.
Related
Section titled “Related”© 2025-2026 Humavera Documentation - BPilot Ltd. All Rights Reserved