

Read the skill heatmap
What this achieves
Section titled “What this achieves”The heatmap lays skills across the top and people or departments down the side, and colours each cell by proficiency. It answers “who has what”, which is the question gap analysis cannot answer because it counts shortfalls rather than showing them.
Required role: Administrator.
- Go to Talent & Growth → Insights → Skill Heatmap.
- Choose the Scope.
- For Department or Team, choose which one.
- Optionally narrow the columns with the Skill Category filter.
- Select a cell to drill in.
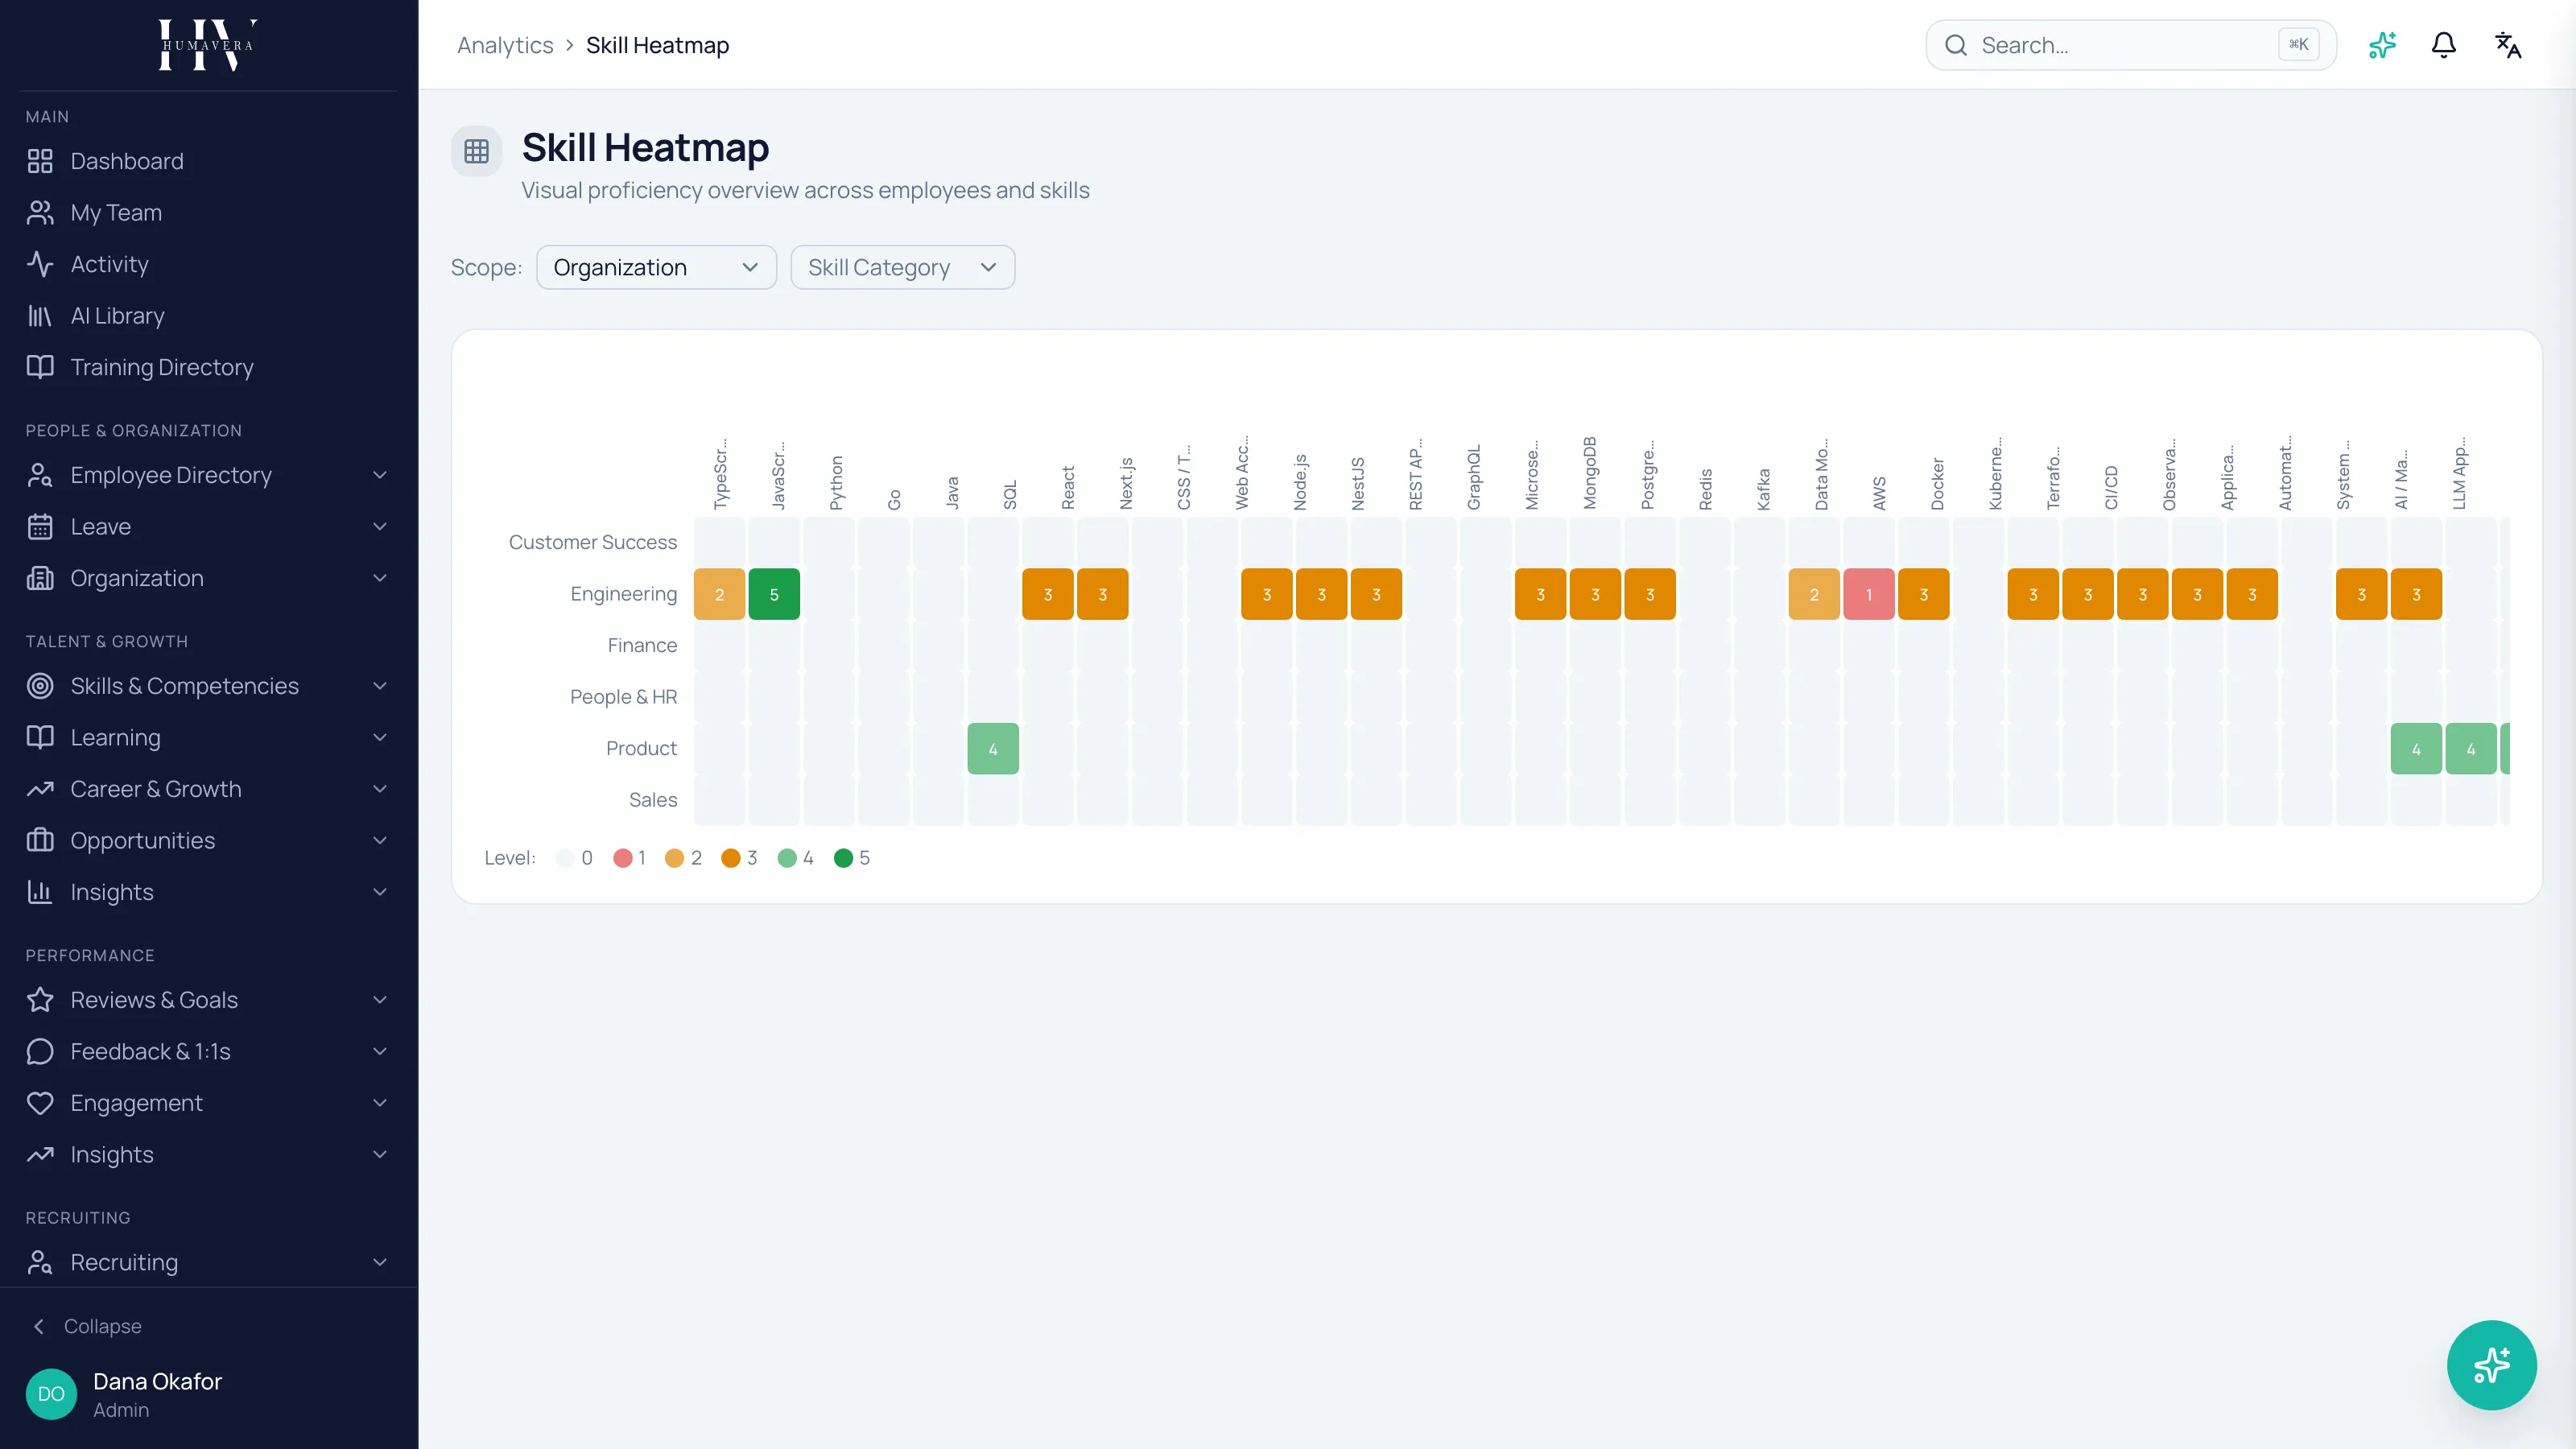
The rows mean something different at each scope
Section titled “The rows mean something different at each scope”This is the thing to establish before reading anything on the grid. The scope does not filter the same view — it changes what a row is and what a cell contains.
| Option | Description |
|---|---|
| Organization | One row per department. Each cell is that department’s average proficiency in that skill. |
| Department | One row per employee in the department. Each cell is that person’s current level. |
| Team | One row per employee in the team. Each cell is that person’s current level. |
Example: at HC Corp, the Organization view shows Engineering as one row averaging 34 people. Switching to the Department scope and choosing Engineering replaces that one row with 34 rows, one per person. An average of 3 can hide a team where half are at 5 and half are at 1.
Reading the colours
Section titled “Reading the colours”Cells are coloured across six proficiency values, from Not Assessed through to Expert. Hovering a cell names the person or department, the skill, and the level.
Not Assessed is a distinct value, not a low score. A blank-looking row usually means nobody has recorded that skill rather than that nobody has it — those are very different findings, and only one of them is about capability.
Example: a Sales row at HC Corp showing Not Assessed across most columns tells you Sales has not recorded its skills. It does not tell you Sales lacks them.
At department and team scope, cells can also carry a small trend marker showing whether the level is rising, falling, or steady.
Drilling in
Section titled “Drilling in”| Option | Description |
|---|---|
| Select a department row at Organization scope | Switches the view to that department, replacing the average with the individuals behind it. |
| Select an employee row at Department or Team scope | Opens that employee’s record. |
The drill-down is the point of the screen. Read the Organization view to find where to look, then drill in, because an average is a starting point and never a conclusion.
Filtering by category
Section titled “Filtering by category”The Skill Category filter narrows which skills appear as columns. Use it when the grid is too wide to read — a heatmap of every skill in the library is a picture, not a report.
When the grid is empty
Section titled “When the grid is empty”The screen says that no skill assessment data is available for the scope, and that employees need skills assigned and assessed. That is the actual cause almost every time: the analysis has no ratings to draw, not zero capability.
Assessment freshness matters here too. A level recorded years ago still shows as a level on this grid, so read the heatmap alongside skill freshness rather than on its own.
What happens next
Section titled “What happens next”The heatmap tells you the shape of a gap, which decides the response. Capability concentrated in one or two people is a key-person risk and a reason to spread it deliberately. Capability missing across a whole team is a hiring or training decision. Both look identical in a gap count and obvious on the heatmap.
Related
Section titled “Related”© 2025-2026 Humavera Documentation - BPilot Ltd. All Rights Reserved